 KitDesk
Utilisation reports: what "hardest working" is actually counting
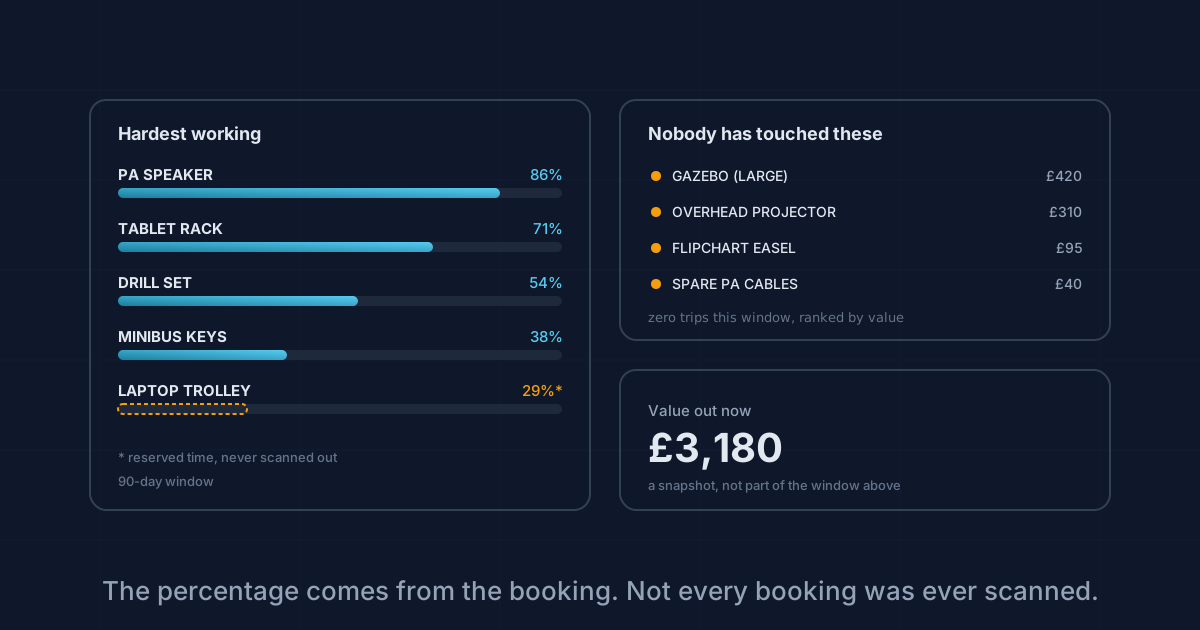
The reports page ranks kit by hours out and flags what nobody's touched. Both numbers come from the booking, not a sensor on the item, and that gap matters.
Somebody on the finance side asks, once a year, whether the department really needs eight more tripods or whether the six it has are mostly sitting in the cupboard. That question is what the reports page is for, and it's a more useful page than the audit, because an audit tells you what's there, not what's used.
We read reports.js and the report screen rather than describe the dashboard from memory. The two headline numbers on that page, "hardest working" and "nobody's touched these", sound like they come from a sensor watching each item. They don't. They come from the booking record, and that difference is worth being honest about before anyone takes the percentage to a budget meeting.
What "utilisation" actually measures
Pick a reporting window (30, 90, 180 days or a year, from buttons on the page) and KitDesk pulls every booking for that org that overlaps it. For each one it works out how many hours the item was "out", clips that to the window, and adds it up per item. Divide by the number of hours in the window and you get a percentage: a tripod out 180 hours of a 720-hour month is at 25%.
Here's the part that isn't obvious from the screen. The hours-out calculation looks like this in the code:
const start = new Date(booking.checkedOutAt || booking.startsAt);
const end = new Date(booking.returnedAt || booking.endsAt);
If the item was actually scanned out and back in, kiosk or QR, those timestamps are real and the number is real. But if a booking sits at status reserved with nobody having scanned anything, the calculation falls back to the scheduled start and end time instead. A governor books a laptop for Wednesday afternoons, the booking gets approved, and if nobody at the front desk bothers logging the physical handover, the report still counts those Wednesday afternoons as hours out. It's counting the booking, not the borrowing. For a site that runs kiosk check-in properly this barely matters, since checkedOutAt and returnedAt are almost always set. For a site that approves bookings and leaves it there, "utilisation" is really "how much got booked", which is a different and slightly more flattering number.
The dead stock list
The more useful figure sits next to it. Items with zero trips in the window, sorted by replacement value, under the heading "Nobody has touched these." This is the one worth printing before a spending decision. If the projector that cost £600 hasn't left the store in ninety days, that's the number that answers "do we need another one" better than any spreadsheet someone built by hand. On the live report it's capped at twenty rows, worst offenders first by value, and it only shows once an item genuinely has zero bookings in the window. Not low use. Zero.
If your brand file has hire charging switched on, that stat card gets replaced by a hire revenue figure instead. KitDesk's own site runs with charging off, which is the more common case for schools, clubs and churches, so the idle-item count is what shows.
What the CSV export leaves out
There's a download button next to the date range, and it's worth knowing what it actually contains before you rely on it for a meeting. The CSV route (/api/reports/utilisation.csv) exports exactly one table: ref, name, category, status, trips, hours out, utilisation percentage, replacement value, and charge. That's it. The "who borrows most" list and the four headline totals (bookings, on-time rate, late count, value currently out) only exist on screen. If someone needs the borrower ranking in a spreadsheet, right now the only route is to screenshot it or copy the numbers by hand. Worth flagging if you're the one building the governors' pack.
Who can see it
The whole /api/reports router requires an owner or admin role. Staff accounts, and the outside borrowers tracked without logins, never see this page. That's by design, since it's a budgeting tool rather than a day-to-day booking one. If the person who wants the utilisation numbers is a bursar or treasurer without an admin login, someone with owner or admin access has to pull it for them or, cleaner, give them their own admin account rather than share credentials.
The window itself
The date picker offers 30, 90, 180 or 365 days, but the API will honour anything from 7 days up to 730 (two years) if you change the days parameter directly. Past a year the number gets less useful for a live utilisation picture and more useful as a long-run "has this thing ever left the shelf" check, which is really the same job the dead-stock list already does better.
Value out now is a snapshot, not a window figure
One stat sits apart from the rest: "value out now" isn't calculated from the reporting window at all. It sums the replacement value of whatever currently has status out, at the moment the page loads, regardless of whether you're looking at 30 days or a year. Change the date range and every other number on the page moves; that one doesn't, because it isn't answering a question about the past, it's answering "if all of this went missing today, what would it cost." Worth knowing so you don't assume a longer window would change it.
None of this makes the report wrong. It makes it a proxy built from booking data, which is the only data KitDesk actually has unless kiosk check-in is switched on and used properly at the cupboard door. Treat "hardest working" as a good guide to what people are asking for, treat the idle list as a genuinely reliable guide to what to stop buying, and treat the exact percentage on a manually-approved booking as an estimate rather than a fact.
Tracking equipment the hard way?
KitDesk does the boring part: labels, bookings, reminders and a list of what never came back.
Try the demo